The class file specifies the relationships between a set of elements and a set of classes.
Class memberships must be formatted as text containing at least 2 columns separated by a tab character. The first column indicates the element names, the second the class names.
          member1	class_1
          member2	class_1
          member3	class_2
Optionally, the file may contain additional columns, which will be ignored. The option score column
          member1	class_1	score_1
          member2	class_1	score_2
          member3	class_2	score_3
Each query class is compared to each reference class, to compute the number of shared elements (intersection) and various statistical scores related to this number.
Prevent to compare each class with itself.
Skip the reciprocal comparisons: if reference A has already been compared to query B, then reference B does not need to be compared to query A, since the comparison statistics are symmetrical.
With matrix output, this returns only the lower triangle fo the matrix.
The program returns a tab-delimited file with one row per pair of reference-query class, and one column per statistics.
Return a reference/query matrix, where each row corresponds to a reference class, each column to a query class, and each cell contains a comparison between the two classes.
Return fields are grouped by categories, so that each request will return several columns. For example, the group "proba" returns the P-value, the E-value and the significance.
Group Field Description occ Q Number of elements in class Q occ QR Number of elements found in the intersecion between classes R and Q occ QvR Number of elements found in the union of classes R and Q. This is R or Q. occ R Number of elements in class R freq E(QR) Expected number of elements in the intersection freq F(!Q!R) frequency of !Q!R elements relative to population size. F(!Q!R)=!Q!R/P freq F(Q!R) frequency of Q!R elements relative to population size. F(Q!R)=Q!R/P freq F(Q) frequency of Q elements relative to population size. F(Q)=Q/P freq F(QR) frequency of QR elements relative to population size. F(QR)=QR/P freq F(R!Q) frequency of R!Q elements relative to population size. F(R!Q)=R!Q/P freq F(R) frequency of R elements relative to population size. F(R)=R/P freq P(QR) probability of Q and R (Q^R), assuming independence. P(QR) = F(Q)*F(R) freq P(Q|R) probability of Q given R. P(Q|R) = F(QR)/F(R) freq P(R|Q) probability of R given Q. P(R|Q) = F(QR)/F(Q) proba E_val E-value of the intersection. E_val = P_val * nb_tests proba P_val P-value of the intersection, calculated witht he hypergeometric function. Pval = P(X >= QR). proba sig Significance of the intersection. sig = -log10(E_val) jac_sim jac_sim Jaccard' similarity. jac_sim = intersection/union = (Q and R)/(Q or R) dotprod dotprod Dot product (using the score column) dotprod dp_bits dp_bits = round(log2_dp). The log2 of the dot product is rounded to obtain an integer value dotprod log2_dp Log2 of the dot product dotprod prodrts Sum of the sqrt of products. This is a sort of dot product but the sqrt of each pairwise product is taken before summing. dotprod sqrt_dp Square root of the dot product entropy H(Q) Entropy of class Q. H(Q) = - F(Q)*log[F(Q)] - F(!Q)*log[F(!Q)] entropy H(Q,R) Join entropy for classes Q and R. H(Q,R) = - F(QR)*log[F(QR)] - F(Q!R)*log[F(Q!R)] - F(R!Q)*log[F(R!Q)] - F(!Q!R)*log[F(!Q!R)] entropy H(Q|R) Conditional entropy of Q given R. H(Q|R) = H(Q,R) - H(R) entropy H(R) Entropy of class R. H(R) = - F(R)*log[F(R)] - F(!R)*log[F(!R)] entropy H(R|Q) Conditional entropy of R given Q. H(R|Q) = H(Q,R) - H(Q) entropy I(Q,R) Mutual information of classs Q and R. I(Q,R) = H(Q) + H(R) - H(Q,R) entropy IC Information content (as defined by Schneider, 1986). IC = F(QR) log[F(QR)/F(Q)F(R)] entropy U(Q|R) entropy U(R|Q) entropy dH(Q,R) Entropy distance between classes Q and R. dH(Q,R) = H(Q,R) - H(Q)/2 - H(R)/2
A lower and an upper threshold can be imposed on various fields in order to restrict the result. To avoid applying a threshold, leave the box empty or write none.
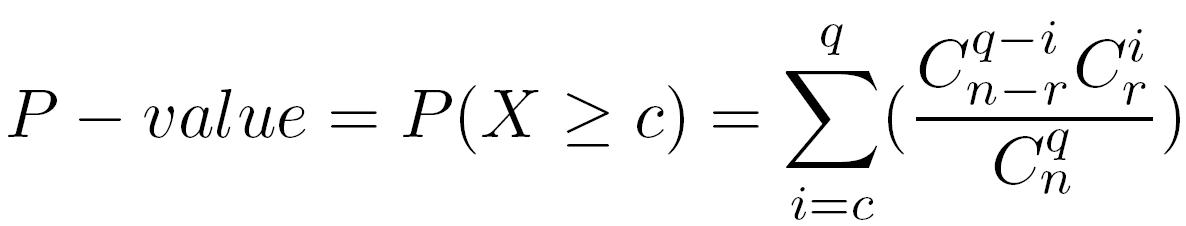
The P-value is the probability to observe at least c common elements between a given query class and a given reference class. It is computed using the hypergeometric distribution.
Let us assume that we have :
The P-value can be interpreted as an estimation of the false prediction risk (FPR), i.e. the fact to consider the intersection between two given classes as significant whereas it is not.
Note that the P-value only concerns one comparison between a precise query class and a precise reference class. This is called a nominal P-value because it is attached to one particular test among a series of multiple tests (since we compare each query class to each reference class). The multi-testing correction is done by computing the E-value, as explained in the next section.
Assuming that there are x query classes and y reference classes, each analysis consists in x*y comparisons. Thus, the P-value can be misleading, because even low P-values are expected to emerge by chance alone when the number of query and/or reference classes is very high. The E-value (E_val) reflects better the degree of exceptionality.
The significance index is the minus log of the E-value. It is calculated in base 10.
This index gives an intuitive perception of the exceptionality of the common elements : a negative sig indicates that the common matches are likely to come by chance alone, a positive value that they are significant. Higher sig values indicate a higher significance.